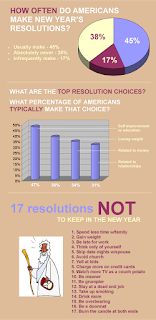
 This post is an attempt to get two birds with one stone. I want to talk about recycling old blog posts (the second part of the title). I've read a lot about doing it on other blogs. But it really wasn't until recently that I got into the recycling business myself ~ and in the following new way: via infographics. (Another term for infographic is: data visualization.)
 And I didn't really start noticing infographics until recently. And I've become fascinated by them. (How 'bout you?) A cool site to check out is: http://visual.ly/. There you'll find a searchable database of infographics / data visualizations, many of which offer html code so you can embed them on your own blog or website.
INFOGRAPHIC "HOW TO"
But I wanted to make my own infographics rather than just posting others, is really where I found myself. And so I was able to devise a way using Microsoft Publisher. I want to share that with you here as a "how to."
TWO EXAMPLES
Both of the infographics you see here are my creations and meant as examples for you. (Click either image to enlarge, then in new browser tab or window click again.)
BACKGROUND SCHEME
Each infographic is a little bit different (obviously). The first one has just a color background (tan) while the other has a Christmas tree background (clip art). So that's where you start with some kind of background scheme. (I get my clip art free at microsoft.com.)
TEXT COLORS
Then you decide on text colors that complement your background. I've got four in each (with white included). I probably wouldn't go beyond that.
BRAINSTORM TOPICS
 Next (and really you could / should do this initially) is to brainstorm and research your topic. Christmas was a pretty easy one as you can see. Each of the terms is just a text box and I mostly choose to use Arial as my font while varying the size. It gives an attractive tone.
In the other infographic (at the top) I googled information on New Year's resolutions and found a good article with stats, then used Microsoft Excel to create the graphs (which is just so easy to do if you know Excel).
RECYCLING OLD BLOGS
Still in the same infographic I want you to notice the "17 Resolutions NOT to Keep in the New Year" area which is my giving that old blog post new life emphasis now. That was a blog from the past, all text ~ which, of course, I could have just re-broadcast like that, but instead I was able to package it in a different and visually appealing way.
FINAL STEPS
Final steps in completing your infographic: select all fields (Ctrl-A), then group lock. Then right click anywhere on your creation, save as a png picture file, change resolution to commercial printing (very important) and voila!
You've got an infographic (created by you) to upload to your own blog or website.
I'd love to hear if you tried this "how to" out. :)
You might also be interested in:
No comments:
Post a Comment